
Virtual Beach
Virtual Beach is a free software program for Windows that enables coastal beach managers, public health professionals, and applied researchers to efficiently develop and operate water-quality models to inform beach-specific decisions on whether to issue (or lift) swim advisories/closures on a given day.
What is Virtual Beach?
Beaches provide coastal communities with substantial economic, social and health benefits. Along the U.S. Great Lakes coast, an estimated 8 million people visit beaches each year. Unfortunately, some information commonly used to evaluate water quality, communicate health risks and prioritize remediation efforts are 24 hours old, meaning swimmers can be swimming when conditions are not safe. Conversely, swimmers may be kept out of the water when no current problems exist.
Virtual Beach addresses these short-comings by providing beach managers with a more timely and cost-effective alternative to traditional monitoring. With funding from the EPA BEACH Grant, coastal beaches are periodically monitored for fecal-indicator bacteria; enterococci in marine waters, E. coli in the Great Lakes. The standard approach is to collect water samples, transport them to a lab, and incubate them for 18+ hours, in order to estimate bacteria levels.
The results of overnight lab tests are often not reflective of water quality at the time when advisory decisions are made. An analysis by Mednick and Watermolen, (2014), showed that across the Great Lakes, between 2008 and 2010, nearly one in five decisions to post (or remove) swim advisories or closures were made in error, including nearly 3,000 unnecessary advisories/closures and at least 4,500 missed advisories or closures. Moreover, the traditional approach to monitoring can place a financial and human-resource strain on local health departments (Rockwell et al. 2014).
The free Virtual Beach desktop software walks users through the process of developing, evaluating, and operating statistical models to predict (‘nowcast’) water quality in near real-time, based on field-observed and/or remotely-measured environmental conditions. The software was developed by the U.S. EPA’s Ecosystem Research Division, in partnership with the USGS Wisconsin Water Science Center, the Wisconsin Dept. of Natural Resources, and Wisconsin Sea Grant.
Virtual Beach combines advanced statistical methods with hydro-meteorological data.
These tools enable users to develop nowcast models that can estimate water-quality conditions at any time – on both sampled and non-sampled days – at virtually any monitored beach on the Great Lakes Coast.
Recognizing the advantages of nowcast modeling, EPA’s most recent Recreational Water Quality Criteria and National Beach Guidance encourage state and local beach programs to adopt this approach – both to improve advisory decisions and to augment lab-based monitoring. Between 2010 and 2014, the use of nowcast models around the Great Lakes increased from fewer than 10 beaches in 2010 to over 60 beaches in 2014.
Wisconsin Sea Grant and its partners are lowering the barriers to adopting Virtual Beach, through a combination of technical enhancements and cooperative extension directed at local public health professionals, beach managers, and applied researchers throughout the Great Lakes. Future projects will encourage the adoption of VB along the Canadian Great Lakes coast, as well as the U.S. marine coast.
Should I Create A Model For My Beach?
A predictive water quality model is a tool that may work wonderfully for predicting bacteria levels at your beach while both REDUCING the number of bacteria samples you need to collect during the swim season and STILL protecting public safety. However, a predictive model is not an appropriate tool for every beach. Using predictive water quality model for a beach has both PROS and CONS.
Pros:
- The model may predict bacteria levels at your beach more accurately than yesterday’s bacteria sample results.
- Sampling costs may be reduced in the long run.
- For beaches on the Great Lakes, additional weather and stream flow data may be available to allow for models to be created for use on non-sampling days so that predictions of bacteria levels at your beach could be made every day during the swim season.
Cons:
- The model building process can be time and money intensive
- Explaining to the public that a beach is under advisory because of a model result is often more complicated than just stating a bacteria result is over a standard.
- Models are not perfect and sometimes advisories will be issued when bacteria levels were low or not issued when bacteria levels are elevated.
Work through the following questions, adapted from the US EPA publication “Six Key Steps for Developing and Using Predictive Tools at Your Beach”, to help determine if a predictive model would be a good fit for your beach.
- Are bacteria levels are known to stay the same at your beach for more than 24 hours? If so, water sampling and laboratory analysis alone will most likely protect swimmer health adequately.
- Are rapid bacteria sampling methods, such as qPCR, used daily at your beach? If so, the results will come back quickly enough to most likely protect swimmer health adequately.
- Are the bacteria results from your beach always (or almost always) below or above recreational water quality standards? If bacteria sampling results exceed standards less than 20% of the time, a model would probably not predict the very few elevated bacteria events based on previous sampling. If bacteria sampling results exceed standards more than 80% of the time, a model would probably not predict the very few situations when the water at the beach does not exceed standards based on previous sampling.
If it appears that modeling would work for your beach, there are still some practical questions to be answered before embarking on creating a beach model.
- Are long term conditions at your beach consistent? If your beach has random, unpredictable events that impact it – such as frequent, but unpredictable, sewage spills or irregular visits from water fowl – bacteria levels may not be easy to predict.
- Are historical bacteria data available for your beach? At least 50 sampling events over 3 seasons are recommended for creating models.
- Do you have enough resources to develop and maintain a model? You will need personnel and technical experts for data collection and model creation, equipment for monitoring, and funds for model upkeep.
If creating a predictive model for your beach sounds like a good fit for your beach, this website will help you learn how to use one software package, Virtual Beach, to develop models for your beach.
Training
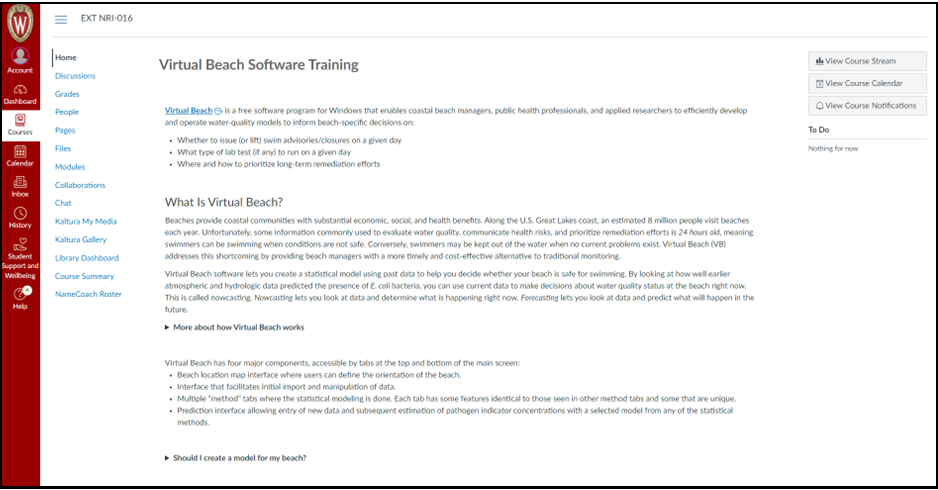
Training modules for Virtual Beach are available as an asynchronous course in Canvas. Please contact Natalie Chin (nchin5@aqua.wisc.edu) for course access.
User Guides
FAQs
Best Practices for Operating and Maintaining Water-Quality Nowcasts
A list of commonly asked questions and suggestions for variables to use in building a VB model can be found in the document below:
Online Data Sources
To develop a Virtual Beach (VB) model, one needs historical data on water quality from two or more beach seasons, together with potentially related environmental conditions, such as stream discharge, antecedent rainfall, wave height, waterfowl, etc. Depending on the beach, many if not all of these data will be available online, for free.
Water Quality & Beach Conditions
Historical water quality can be downloaded from EPA’s BEACON website – or from the state beach websites listed below. Depending on the state, field-collected sanitary survey data, such as turbidity, algae levels and gulls, may also be available. Note: If you have sanitary survey data for your beach, it is to your advantage to upload them to your state’s beach website. This will make building and maintaining VB models significantly easier.
- Illinois Beach Guard Viewable tables of coli data. Single-day summaries of sanitary survey results.
- Indiana Beach Guard Viewable tables of coli data. Single-day summaries of sanitary survey results.
- Michigan Beach Guard Viewable tables of coli data. Single-day summaries of sanitary survey results.
- Minnesota Lake Superior Beach Monitoring Downloadable tables of coli + some sanitary survey data.
- New York: No state beach website. (Use EPA’s BEACON or request from counties.)
- Ohio Beach Guard: Viewable tables of colidata. Single-day summaries of sanitary survey results.
- Pennsylvania: No state website. (Use BEACON or request from Erie County.)
- Wisconsin Beach Health Downloadable tables of coli + sanitary survey data.
Where to Get Your Data
If you are getting data in the field, you can just go to the beach to collect it. If you are getting your data online, there are a variety of resources you can use. Although there isn’t one correct data source, you do want to make sure the data source you use has both historic data you can use to develop your model and current data, or real time data, you can use to make daily predictions. The longer the data source is available in the past, the more data you will have available to build your model.
Try to pick data sources you know will be reliable such as state, federal, and university data sources. If your data source goes away or data collection methods change, , you will need to find comparable data or rebuild your model.
For online data sources here’s a list of places you may start looking for information:
- Water temperatures (real-time or 6, 12, 24 hour time averaged)
- Air temperatures (real time or 6, 12, 24 hour time averaged)
- NOAA National Weather Service – https://www.weather.gov/wrh/climate
- NOAAPORT Realtime Great Lakes Weather Data and Marine Observations – https://coastwatch.glerl.noaa.gov/marobs/
- Wind speeds (real time or 6, 12, 24 hour time averaged)
- NOAA National Weather Service – https://www.weather.gov/wrh/climate
- Local weather sites/stations
- GLOS Seagull Observing System – https://seagull.glos.org/map?coords=-84.1312590%2C44.1490000%2C5.5&tags=platforms%3Abuoy%2Cweather%3Awind_current%2Cwater%3A%2Cfavorite%3A%2Corg%3A
- NOAAPORT Realtime Great Lakes Weather Data and Marine Observations – https://coastwatch.glerl.noaa.gov/marobs/
- Wind directions (real time or 6, 12, 24 hour time averaged)
- GLOS Seagull observing system – https://seagull.glos.org/map?coords=-84.1312590%2C44.1490000%2C5.5&tags=platforms%3Abuoy%2Cweather%3Awind_current%2Cwater%3A%2Cfavorite%3A%2Corg%3A
- NOAAPORT Realtime Great Lakes Weather Data and Marine Observations – https://coastwatch.glerl.noaa.gov/marobs/
- Wave heights and wave height statistics (e.g. real-time wave heights; 6, 12, 18, or 24 hour average wave heights; maximum wave heights; wave periods; etc.)
- NOAAPORT Realtime Great Lakes Weather Data and Marine Observations – https://coastwatch.glerl.noaa.gov/marobs/
- Wave directions
- NOAAPORT Realtime Great Lakes Weather Data and Marine Observations – https://coastwatch.glerl.noaa.gov/marobs/
- Cloud cover percentage
- NOAA National Weather Service – https://www.weather.gov/wrh/climate
- Local weather sites/stations
- Rainfall (6, 12, 24, or 48 hour totals)
- NOAA National Weather Service – https://www.weather.gov/wrh/climate
- NCRFC Observed Precipitation data – https://www.weather.gov/ncrfc/LMI_NcrfcObservedPrecipitation
- Inflow from nearby tributaries (real time, 6 hour, 12 hour, 24 hour averages or totals)
- USGS Daily Streamflow Conditions – https://waterdata.usgs.gov/nwis/rt
- Lake levels (real time, or 6, 12, 24 hour averages)
- NOAA Lake Level Viewer – https://coast.noaa.gov/llv/
- NOO Great Lakes Water Level Monitoring Network – https://www.glerl.noaa.gov/data/wlevels/#monitoringNetwork
- Surface current speed (real-time or 6, 12, 24 hour time averages)
- GLOS Seagull platform – https://seagull.glos.org/map?coords=-84.1312590%2C44.1490000%2C5.5&tags=platforms%3Abuoy%2Cweather%3Awater_current%2Cwater%3A%2Cfavorite%3A
- NOAAPORT Realtime Great Lakes Weather Data and Marine Observations – https://coastwatch.glerl.noaa.gov/marobs/
- Surface current direction (real-time or 6, 12, 24 hour time averages)