
Coastal processes
Different Types of Waves and Currents and How They Form
Waves moving toward the shore
As waves travel toward shore, they shoal. As waves shoal, the distance between wave crests decreases and the wave heights increase. When a wave gets too steep, it begins to break a bit. On rough days, the breaking tops of waves can be seen all over the lake. As waves get close to shore, the way in which they break varies depending on the shape of the shoaling lakebed.
A steep nearshore lakebed slope will cause approaching waves to rise quickly to a height dependent on water depth, and then plunge quickly. These waves provide the most exciting, but shorter ride for surfers. A more gentle lakebed slope will cause approaching waves to gradually spill their energy, providing a longer, easier ride for surfers. The most gentle lakebed slope will cause a surging of the breaking wave onto the beach…an uninteresting situation for surfers.
Water at the shoreline with somewhere to go
As waves approach shore, they drag some of the water with them, assisted by the wind when it is blowing onshore. This excess water piles up between the breakers and the beach at a level higher than the lake level (sometimes elevated as much as 10 to 20 percent of the breaking wave heights). The steeper the beach slope, the wider the surf zone, the higher the waves, the higher the water will pile up. The surf zone is the area between the breaking waves and the beach where waves run up and rush back into the lake. Gravity rules that the water that comes ashore must return offshore. The elevated water moves from the surf zone inside the breakers towards the lower water level beyond the breakers. This water moves either offshore as a return flow (sometimes called an undertow) under the breaking waves, or along the shore as a current that then turns offshore as a rip current.
Undertow
Usually, this flow is dispersed along the shore and moves lakeward in the lower half of the water column beneath the waves with the highest velocities close to the lakebed between the breakers and shore. Under mild conditions with small to moderate waves (less than two feet high to three feet high), this return flow is not usually a problem for agile swimmers and waders, except sometimes for small children. The undertow is strongest when the waves are high and approaching nearly perpendicular to shore.
Longshore currents
Longshore currents may flow in one direction along the shore between the breakers and the shore. These currents may form circulatory patterns, leaving the shore in narrow rip currents and returning to shore as dispersed flow with the breaking waves. The longshore current is strongest when the waves are high and approaching at a greater angle from the perpendicular to shore. If you are standing on the beach, facing the water, and the waves are approaching at an angle to the shore from the right, the longshore current is probably moving in one direction towards your left. The highest velocities in a longshore current are typically near the water surface and nearer the breakers than the shore. Longshore currents can be escaped by swimming towards the shore and/or wading to shore.
Rip currents
Rip currents occur where a longshore current meets a physical barrier such as a peninsula, headland, long groin, harbor breakwater, nearshore reef, or shoal, and is deflected lakeward. These currents also occur along an open beach where there is less resistance to lakeward flow, such as places where the breaking waves are lower, or where there is a gap or trough in the nearshore sand bars. Once a rip current is established, it can scour its own channel through the bars and be a relatively stable current until wave conditions change. Rip currents are usually narrow. Swimmers can escape them by swimming perpendicular to the flow (parallel to shore) a short distance. For more information see ripcurrents.noaa.gov
How strong are nearshore currents?
Longshore currents may be moving at two to four miles per hour under conditions that include breaking waves that are three to eight feet high and approaching shore at roughly 20 degrees from the perpendicular to shore. Even though an adult can normally wade in these currents, such high velocities can be fatiguing and sweep a person along the shore towards a rip current. Longshore currents can also be dangerous at lower speeds of 0.2 to one mile per hour under conditions that include three to six feet high breakers approaching shore at roughly five to 15 degrees from the perpendicular. People have drowned under these lesser conditions. Rip currents can sometimes have relatively high velocities of four to nine miles per hour and are particularly dangerous because they can carry people lakeward beyond the breakers into deep water where the current disperses. Don’t expect to swim against currents with speeds this high. It is difficult to say how strong the return flow (undertow) can be.
How to spot nearshore currents
Floating debris, foam patches or foam lines are helpful indicators of currents. If they are drifting parallel to shore, it is a longshore current. If the debris or foam are drifting offshore, there is probably a rip current present. Rip currents are also indicated by a stretch of relatively unbroken water in the breakers and by a stream of turbid water moving offshore through the breakers as a narrow current before spreading. Undertow can’t be spotted, but only felt because all a shore observer sees is the backwash of breaking waves.
Avoiding trouble
When the lake is rough, swimmers, waders and surfers in the water should stay away from solid structures in the water such as: boulders, groins, reefs, jetties, breakwaters, rocky peninsulas and headlands, revetments, seawalls and artificial cove-like beaches. The combination of strong currents and breaking waves near such structures can bring battering injuries which hinder efforts to withstand the currents and waves. People usually underestimate the force and power of swiftly-moving water. Add in cold water temperatures and the possibility of being overcome by this combination of forces rises fast. Avoid going into the water when the lake is rough because even beaches without solid structures can have dangerous currents. Enjoy the lakeshore beaches and water when the water is calm or the waves are small.
Sources: R. W. G. Carter. 1988. Coastal Environments. Academic Press. New York, NY. 617 pages.
Robert L. Wiegel. 1964. Oceanographical Engineering. Prentice-Hall, Inc., Englewood, NY. 532 pages.
U.S. Army Corps of Engineers. 1984. Shore Protection Manual. Volume 1. U.S. Army Corps of Engineers Coastal Engineering Research Center, Waterways Experiment Station, Vicksburg, MS.
Storm Surges
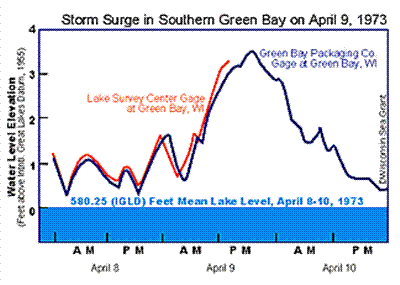
Storm surges are temporary rises in water level caused by storm winds blowing across miles of open water and dragging some water towards the down-wind shore. This causes a build-up in water level along the down-wind shore. The temporary rise in water level may also be called a storm set-up, wind set-up, storm-induced rise, or storm rise. Storm surges occur on ocean coasts as well as on Great Lakes coasts. The image below shows an extreme storm surge in the southern end of Green Bay at the City of Green Bay, Wisconsin.
A storm surge typically rises about as fast as the onshore wind speed rises, but with a little time delay. The surge typically lasts about as long as the strong winds are blowing onshore. A storm surge may last all day. Great Lakes storm surges range from one to eight feet in height. Storm surges caused by hurricanes raise sea levels on ocean coasts by ten to twenty feet or more.
The greatest surges on the Great Lakes occur at the eastern and western ends of Lake Erie and in shallow bays exposed to long distances of water surface across which storm winds blow. The lower end of Green Bay is one of those locations where large surges can occur. Storm surges are probably negligible on open shores of small islands and on the ends of peninsulas or points of land.
On enclosed water bodies, storm winds lower the water level on the upwind shore. The drop in water level is called a set-down and is similar in magnitude to the storm surge. On Lake Erie, a storm surge at Buffalo on the eastern end of the lake and the set-down on the western end of the lake have caused a water level difference of up to 15 feet.
The NOAA Great Lakes Environmental Research Laboratory web site has information about a series of storm surges that occurred across the Great Lakes on October 25-27, 2001.
Seiches
Seiches are periodic oscillations of water level set in motion by some atmospheric disturbance passing over a Great Lake. The disturbances that cause seiches include the rapid changes in atmospheric pressure with the passage of low or high pressure weather systems, rapidly-moving weather fronts, and major shifts in the directions of strong winds. Seiches exist on the Great Lakes, other large, confined water bodies, and on partially-enclosed arms of the sea.
The intervals (or periods) between seiche peaks on the Great Lakes range from minutes to more than eight hours. One or more seiches following a storm surge may cause repeated flooding of low-lying property. Small seiches (less than a foot high) are an everyday occurrence on the Great Lakes.
Edge Waves
A rare and dangerous form of storm rise can occur when there is no local storm activity. On May 31, 1998, a line of large and damaging thunderstorms called a derecho (day-ray-co) formed in South Dakota and raced across Minnesota, Wisconsin and Lake Michigan at roughly 50 miles per hour, all the way to New York. Wind speeds increased as this storm system moved swiftly through the night; reaching nearly 100 miles per hour in Michigan.
This rapid squall line created a storm surge (or “wave”) that traveled southeast across Lake Michigan with the squall line very early in the morning of June 1, reaching and reflecting off the shore near New Buffalo, Michigan. This squall line created an edge wave that traveled around the southern end of the lake to Illinois. About 7 am, hours after the storm had raced across the lake, the water level in Calumet Harbor, Illinois, rose five feet in less than half an hour, then dropped, followed by subsequent, but lesser, peak levels about every 90 minutes for several hours. Earlier derechos created edge waves that swept some people off piers and breakwaters.
Sources of information about the May 31, 1998 derecho: Credit: David J. Schwab (NOAA-GLERL), Tad Murty (Baird and Associates), Roger Gauthier (USACE-Detroit District), National Weather Service.
Where to go for further information
The U.S. Army Corps of Engineers (Detroit District) publishes tables of storm-induced rises at selected sites on the Great Lakes at the following web sites:
Short Term Rise of Water Levels
A web page showing short term rise of water levels on Lake Michigan and wind setup events on Lake Erie (one of them is animated), can be viewed under Multimedia, near the bottom of the following Corps of Engineers page:
Storm surge information
Information on storm surges for Canadian and U.S. shores of the Great Lakes can be found in tables of Wisconsin Sea Grant’s Coastal Processes Manual. 2nd Edition. 1998. Check the Publications page at this site for information on how to order.
Some of the results from modeling the Great Lakes hydrologic response to anticipated global warming indicate that low water levels will become common in this century and substantially lower records will be set. Significant changes in water levels may occur within a couple of decades. Other models indicate a continuation of historic, or even higher, lake levels and some greater net basin supplies of water. At this time, it appears that global and regional climate changes will broaden the historic range of water levels in the Great Lakes.
Predicted Great Lakes Water Level Responses to Climate Change
Anticipated future lake levels on Superior, Michigan and Huron due to climate change
This information is based on hydrologic model responses to inputs from Canadian and British global circulation models (GCMs) and from a Great Lakes regional circulation model called CHARM: Coupled Hydrosphere-Atmosphere Research Model at the National Oceanic and Atmospheric Administration’s Great Lakes Environmental Research Laboratory (NOAA-GLERL) in Ann Arbor, Michigan.
Hydrologic models at NOAA-GLERL simulate the natural responses of Great Lakes water levels and flows to runoff, precipitation, evaporation, inflows and outflows. The hydrologic models have been run with input from GCMs for the atmosphere under assumed global warming conditions. The regional model; CHARM has been run to project climate over the Great Lakes Basin in time periods centered at 1989, 2030, and 2095. Predicted lake level response results from an improved CHARM run with a hydrologic response model are expected in 2003.
Some preliminary indications
Modeling with the use of early transient GCMs and the Canadian Centre for Climate Modeling and Analysis’ CGCM1 model indicate a possible major lowering of lake levels and a reduction of water supplies to the upper Great Lakes in two or three decades. Present low water levels provide a taste of this possible future.
Water levels predicted from the dryer climate of the CGCM1 model for the upper Great Lakes have greater variability than the variability experienced between 1961 and 1990 which included record high water levels on Lake Superior and both record high and low water levels on Lakes Michigan and Huron.
The CGCM1 model does not include any representation of the Great Lakes nor interactions between the lakes and the atmosphere. The British Hadley Climate Centre’s HadCM2 model does include a crude representation of the Great Lakes but does not include interactions between the lakes and the atmosphere. The CHARM model includes interactions between the Great Lakes and the atmosphere.
Water levels predicted from the wetter climate of the HadCM2 model for the upper Great Lakes do not have greater variability than the variability experienced between 1961 and 1990 and indicate the possibility of higher-than-record water levels in the future.
Climate change is expected to change the shape of the annual water level cycle which has highest water levels in the summer and lowest water levels in the winter.
The following tables show predicted changes from the average lake levels that occurred during a Base Case period of 1961 to 1990. The predicted changes are for 20 year periods centered on the years 2030 and 2090.
Table 1. Predicted Response of Lake Superior to Climate Change (Global Warming).
| Model | Year | Change in Water Level | |
| feet | meters | ||
| HadCM2 | 2030 | -0.03 | 0* |
| CGCM1 | 2030 | -0.7 | -0.2 |
| HadCM2 | 2090 | +0.4 | +0.1 |
| CGCM1 | 2090 | -1.4 | -0.4 |
*zeros represent non-zero values less than 0.05 m.
Results obtained by using input from four earlier transient GCMs (GFTR2, HCTR2, MOTR2, and CCTR2) indicated water levels on lakes Huron and Michigan may be lower in 2020 by 1.3, 1.6, 4.6 and 3.0 feet ((0.4, 0.5, 1.4, and 0.9 meters), respectively.
Table 2. Predicted Response of Lakes Michigan and Huron to Climate Change (Global Warming).
| Model | Year | Change in Water Level | ||
| feet | meters | |||
| HadCM2 | 2030 | +0.2 | +0.1 | |
| CGCM1 | 2030 | -2.4 | -0.7 | |
| HadCM2 | 2090 | +1.1 | +0.3 | |
| CGCM1 | 2090 | -4.5 | -1.4 | |
*zeros represent non-zero values less than 0.05 m.
Results obtained by using input from four earlier transient GCMs (GFTR2, HCTR2, MOTR2, and CCTR2) indicated water levels on lakes Huron and Michigan may be lower in 2020 by 1.3, 1.6, 4.6 and 3.0 feet ((0.4, 0.5, 1.4, and 0.9 meters), respectively.
Sources of information for Tables 1 and 2 a) Preparing for a Changing Climate, Great Lakes Overview. Peter J. Sousounis and Jeanne M. Bisanz. October 2000. A report of the Great Lakes Regional Assessment Group for the U.S. Global Change Research Program. AOSS Department, University of Michigan, Ann Arbor, Michigan 48109-2143, b) Supplemental information from Brent M. Lofgren, NOAA Great Lakes Environmental Research Laboratory. March 2002.
More About the Models and How to Use the Information in the Tables
Where to get more information on climate change and information on expected water level changes on the other Great Lakes?
More information on the potential lake level changes for all of the Great Lakes as predicted by hydrologic response models and GCMs will be published in a future issue of the Journal of Great Lakes Research in an article titled: Evaluation of Climate Impacts on Great Lakes Water Resources by Brent M. Lofgren, Frank H. Quinn, Anne H. Clites, and Raymond A. Assel. The paper includes results for a period centered in 2050.
Early results from CHARM modeling will be given in a short paper titled: Simulation of Possible Future Effects of Greenhouse Warming on Great Lakes Water Supply Using a Regional Climate Model that has been submitted by Brent Lofgren to the American Meteorological Society’s 17th Conference on Hydrology.
For new developments in modeling estimated impacts of climate change on Great Lakes water levels, periodically check NOAA-GLERL.
For new developments in research on climate change, check NOAA climate change.
Explanation for the predictions of water level changes that are based on models.
Hydrologic models used at NOAA-GLERL simulate the natural responses of the Great Lakes to runoff, precipitation, evaporation, inflows and outflows. The hydrologic models have been run with input from global circulation models (GCMs) for the atmosphere under assumed global warming conditions. The hydrologic modeling was done as recently as 2000 at the National Oceanic and Atmospheric Administration’s Great Lakes Environmental Research Laboratory (NOAA-GLERL) in Ann Arbor, Michigan. Results from improved models are expected in 2003.
About the Models
The CGCM1 model was run at the Canadian Centre for Climate Modeling and Analysis. The HadCM2 model was run at the Hadley Centre in Great Britain. The CGCM1 and HadCM2 models are the most recent GCMs used to estimate Great Lakes water level responses to global warming expected over this 21st century. The CGCM1 model lacks any representation of the Great Lakes. The HadCM2 model has a very crude spatial representation of the Great Lakes that allows for some feedback from the lakes to the atmosphere. Reasons for different results from CGCM1 and HadCM2 models are not known.
All of the recent model runs have used transient GCM models. Transient models incorporate full dynamical ocean models (with their thermal capacity) coupled to a model atmosphere with a gradual rise in greenhouse gases and gradual changes in atmospheric temperatures and precipitation. Transient models create a delay in warming, compared to results from earlier equilibrium models which showed results from a doubling of carbon dioxide in the atmosphere (for example). Results from a more recent HadCM3 model run have not yet been used to estimate Great Lakes water level responses. It is anticipated that this work will also be done at NOAA-GLERL.
How to use the model predictions of lake level change
Example: What do the models predict the water levels will be on Lakes Michigan and Huron in 2030?
Table 2 shows that water levels could be 0.2 feet higher, or 2.4 feet lower, than 1.6 feet above Low Water Datum (Chart Datum). The Base Case period was 1961 to 1990 and contained the lowest water levels of the century in the 1960s and the highest water levels of the century in the 1980s, according to the U.S. Army Corps of Engineers’ Monthly Bulletin of Lake Levels for the Great Lakes. The lower of the two levels predicted for 2030 would be: 1.6 – 2.4 = 0.8 feet below Low Water Datum (LWD).
According to the U.S. Army Corps of Engineers’ Monthly Bulletin of Lake Levels for the Great Lakes, the record low monthly mean lake level during the recreational boating season was 10 inches (0.8 feet) below LWD and it occurred in May, June and September of 1964. July and August levels were only an inch higher. That level is where one model predicts the 20-year average lake level will be in 2030.
Another way to use this information: think of the 1961 to 1990 range of lake levels repeating in 2020 to 2040, but at levels 2.4 feet lower. If this were to occur, a new record low boating season water level would be somewhere around 0.8 + 2.4 feet = 3.2 feet below LWD. For comparison, the level of lakes Michigan and Huron from mid-June through mid-December varied slightly from LWD to 0.1 feet (2 inches) above LWD. What would commercial shipping and recreational boating be like if water levels become three feet lower?